Engagement rate is the metric everyone on Instagram references and almost nobody calculates correctly. It is used to measure content performance, evaluate influencer value, compare accounts, and set campaign expectations. It is also the metric most easily faked, most dependent on context, and most misinterpreted when applied without understanding what the numbers actually mean.
Here is a data-grounded breakdown of what engagement rate actually measures, how to calculate it properly, what good looks like by account size and niche, and how to identify when the numbers have been artificially inflated.
How to Calculate Instagram Engagement Rate Correctly
There are several formulas used for engagement rate and they produce different numbers, which creates confusion when accounts or tools use different calculations.
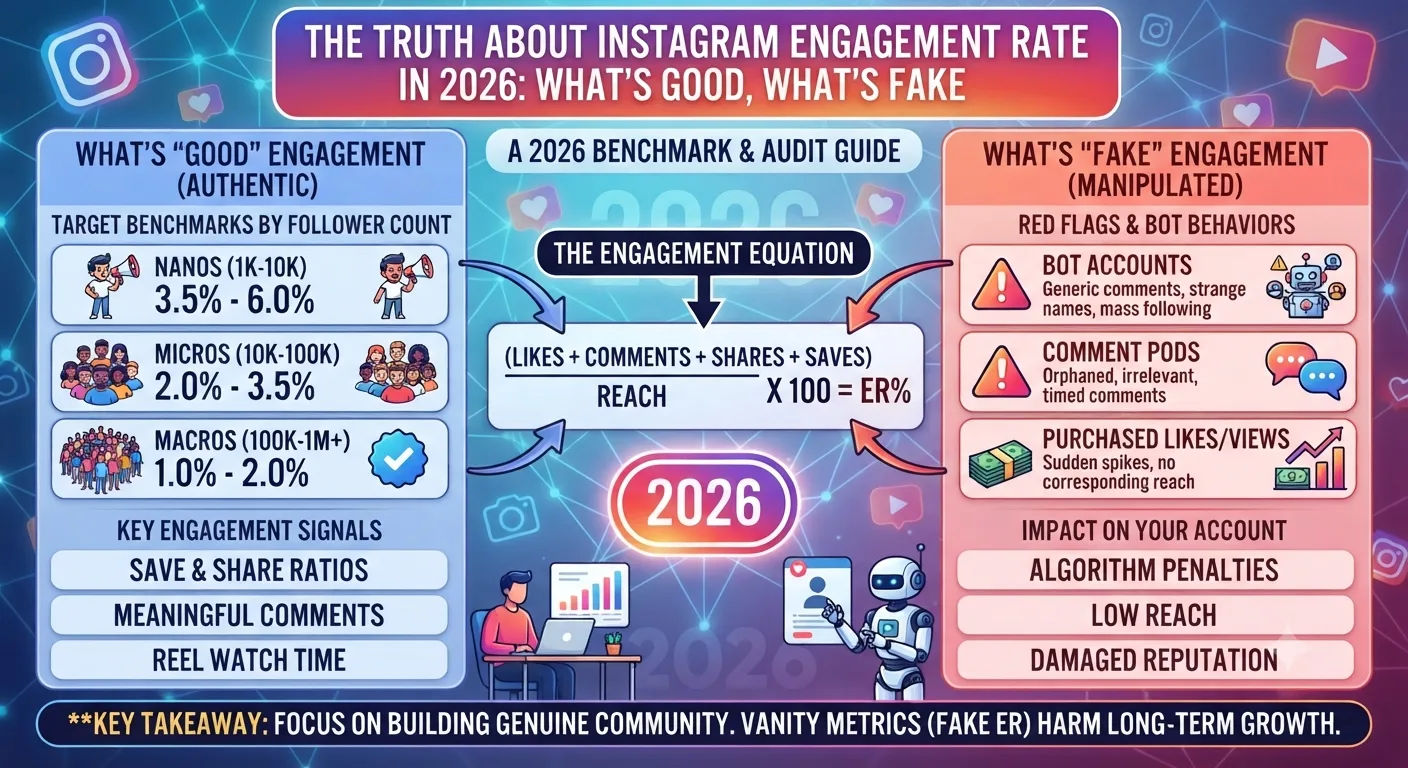
The most widely used formula is engagement by followers: add total likes and comments on a post, divide by follower count, and multiply by 100 to get a percentage. For example, a post with 500 likes and 50 comments on an account with 20,000 followers has an engagement rate of 2.75 percent.
A more accurate formula is engagement by reach: divide total engagement by the number of accounts that actually saw the post rather than total followers. This is more meaningful for measuring content performance because not all followers see every post. However, reach data is only available to the account owner, which is why the follower-based formula is used for external evaluation.
When comparing accounts or evaluating influencers, always confirm which formula the other party is using. An engagement rate calculated by reach will always be higher than one calculated by followers for the same post, since reach is typically smaller than total follower count.
Engagement Rate Benchmarks by Account Size in 2026
These averages reflect the natural dilution effect that occurs as accounts grow. Larger audiences are inherently less cohesive and less likely to engage with every piece of content. A mega-influencer with 5 million followers is not performing poorly at 0.4 percent engagement. A micro-creator with 15,000 followers is performing below average at the same rate.
How Engagement Rate Varies by Niche
Niche matters as much as account size when evaluating engagement rates. Some content categories naturally generate higher engagement than others due to audience behavior patterns, content format preferences, and community culture.
| Niche | Typical Engagement Rate Range | Primary Engagement Driver |
|---|---|---|
| Faith and spirituality | 4% to 8% | Strong community identity, high personal relevance |
| Personal finance | 3% to 6% | Actionable content with high save rates |
| Fitness and wellness | 3% to 5% | Aspirational content that drives comments and shares |
| Food and cooking | 2% to 4% | Recipe saves and sharing, broad audience |
| Travel | 2% to 3.5% | Aspirational imagery, saves for future trips |
| Fashion | 1.5% to 3% | Visual appeal, trend-driven but competitive space |
| Technology | 1% to 2.5% | Educational content, narrower but highly engaged audience |
| Beauty | 1.5% to 3% | Tutorial saves, product recommendations |
| Celebrity and entertainment | 0.5% to 1.5% | Passive consumption, low comment intent |
How to Identify Fake Engagement
Purchased engagement is more detectable than most people assume once you know what patterns to look for. The goal of engagement fraud is to make an account look popular. The execution is almost always imperfect in ways that reveal the underlying deception.
Pattern 1: Engagement Spikes That Don't Match Content Quality
Look at the engagement across the last 20 to 30 posts on an account. Organic engagement is generally correlated with content type and quality, meaning better content performs better but within a consistent range. An account with consistently mediocre content that suddenly receives 10,000 likes on a random post, then returns to 300 likes the following post, shows a clear purchase pattern.
Pattern 2: Generic and Repetitive Comments
Read the comments on multiple posts. Genuine comments reference the specific content of the post. Bot-generated comments are generic phrases that could apply to any post: "So true!", "Love this", "Amazing content", "Keep it up!" applied identically across multiple posts by the same accounts. The same profile pictures and usernames appearing repeatedly across unrelated posts are a reliable signal.
Pattern 3: Follower Growth Spikes on Social Blade
Social Blade tracks public Instagram account follower counts over time. A sudden spike of 5,000 to 50,000 followers over 48 hours followed by a plateau and gradual decline is the signature pattern of a purchased follower campaign. Organic follower growth is steady and tied to content performance. Vertical spikes with no corresponding viral content are almost always purchased.
Pattern 4: Follower to Following Ratio Anomalies
Accounts with extremely high follower counts relative to a very low following count are not inherently suspicious. But accounts with a follower count that grew rapidly while the following count remained static, combined with low engagement, suggest artificial inflation. Compare the account's growth timeline with their content history.
Key Takeaways
- Engagement rate means different things depending on the formula used. Always confirm whether a rate is calculated against followers or against reach before comparing numbers across accounts.
- Average engagement rates decline as accounts grow. A 0.5 percent rate is below average for a small account but acceptable for a mega-influencer with millions of followers.
- Niche matters significantly. Faith, personal finance, and fitness niches consistently see higher engagement rates than fashion, celebrity, and technology niches at comparable account sizes.
- Engagement spikes on mediocre content, generic comment patterns, follower growth spikes on Social Blade, and story view counts disproportionately low relative to follower count are the four most reliable fake engagement signals.
- Save rate is the engagement signal most directly tied to content value and the least susceptible to purchase fraud, making it one of the most trustworthy individual metrics for content evaluation.
Frequently Asked Questions
What is a good engagement rate on Instagram in 2026?
It depends on account size and niche. For accounts under 10,000 followers, 3 to 6 percent is strong. For accounts between 10,000 and 100,000 followers, 1 to 3 percent is healthy. For accounts over 500,000, 0.5 to 1 percent is considered good. Rates significantly below these ranges warrant investigation into engagement authenticity.
Why does engagement rate go down as follower count grows?
Larger audiences are inherently more diverse and less cohesive than smaller ones. Not every follower sees every post, and a larger audience includes more passive followers who do not engage regularly. This natural dilution effect is why engagement rates are always compared within account size tiers rather than absolutely. A large account with a lower raw engagement rate than a small account is not necessarily performing worse relative to its potential.
How do you calculate Instagram engagement rate?
The standard formula is total likes plus comments on a post divided by follower count multiplied by 100. For a more accurate but less comparable metric, divide total engagement by reach rather than followers. For account-level engagement rate, average the engagement rate across your last ten to twenty posts rather than using a single post which may be atypically high or low.
Does Instagram penalize accounts for buying engagement?
Instagram periodically removes fake accounts and purchased followers through algorithmic purges. When this happens, accounts that bought followers see sudden drops in follower count. Instagram also suppresses content distribution for accounts it identifies as using engagement manipulation. The long-term effect of purchasing engagement is almost always negative for organic reach, as the fake followers do not engage with content and lower the genuine engagement rate signal that determines organic distribution.
Should I focus on improving engagement rate or growing follower count?
For most creators and brands, engagement rate is the more meaningful metric. A highly engaged audience of 10,000 followers converts to purchases, partnerships, and real business outcomes more reliably than a disengaged audience of 100,000. Instagram's algorithm also uses engagement signals rather than follower count as the primary driver of content distribution, meaning high engagement typically generates organic follower growth as a byproduct.